
Pipeline & Forecast
The Insights module gives you a clear, data-driven view of your pipeline health and revenue forecast. Use it to spot risks early and make confident revenue predictions.
Pipeline Overview
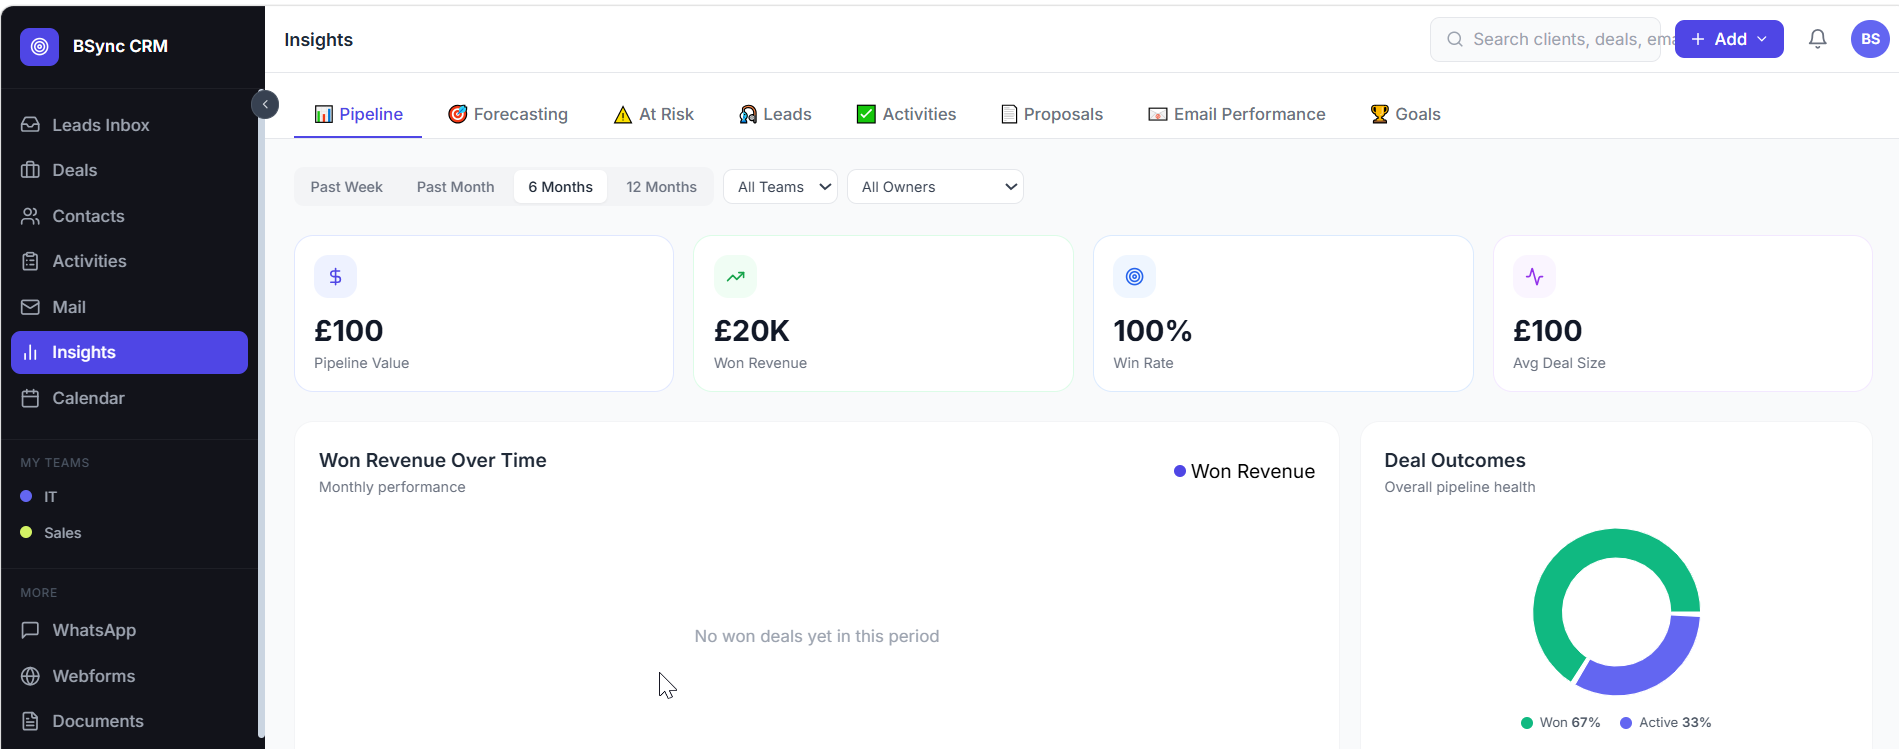
The Pipeline chart shows the total value of deals in each stage, giving you an instant view of where your pipeline value is concentrated.
Key metrics displayed:
| Metric | Description |
|---|---|
| Total pipeline value | Sum of all open deal values |
| Weighted pipeline | Value × stage probability for each deal |
| Average deal value | Mean value across all open deals |
| Average deal age | How long deals have been open on average |
| Conversion rate | % of deals that reach Closed Won |
| Win rate by stage | % of deals that leave each stage as Won |
Filtering the Pipeline Chart
Use the filter controls to narrow the view:
- Date range — created date or expected close date
- Assignee — one team member or all
- Stage — focus on a specific stage
- Tag — filter by deal tags
Revenue Forecast
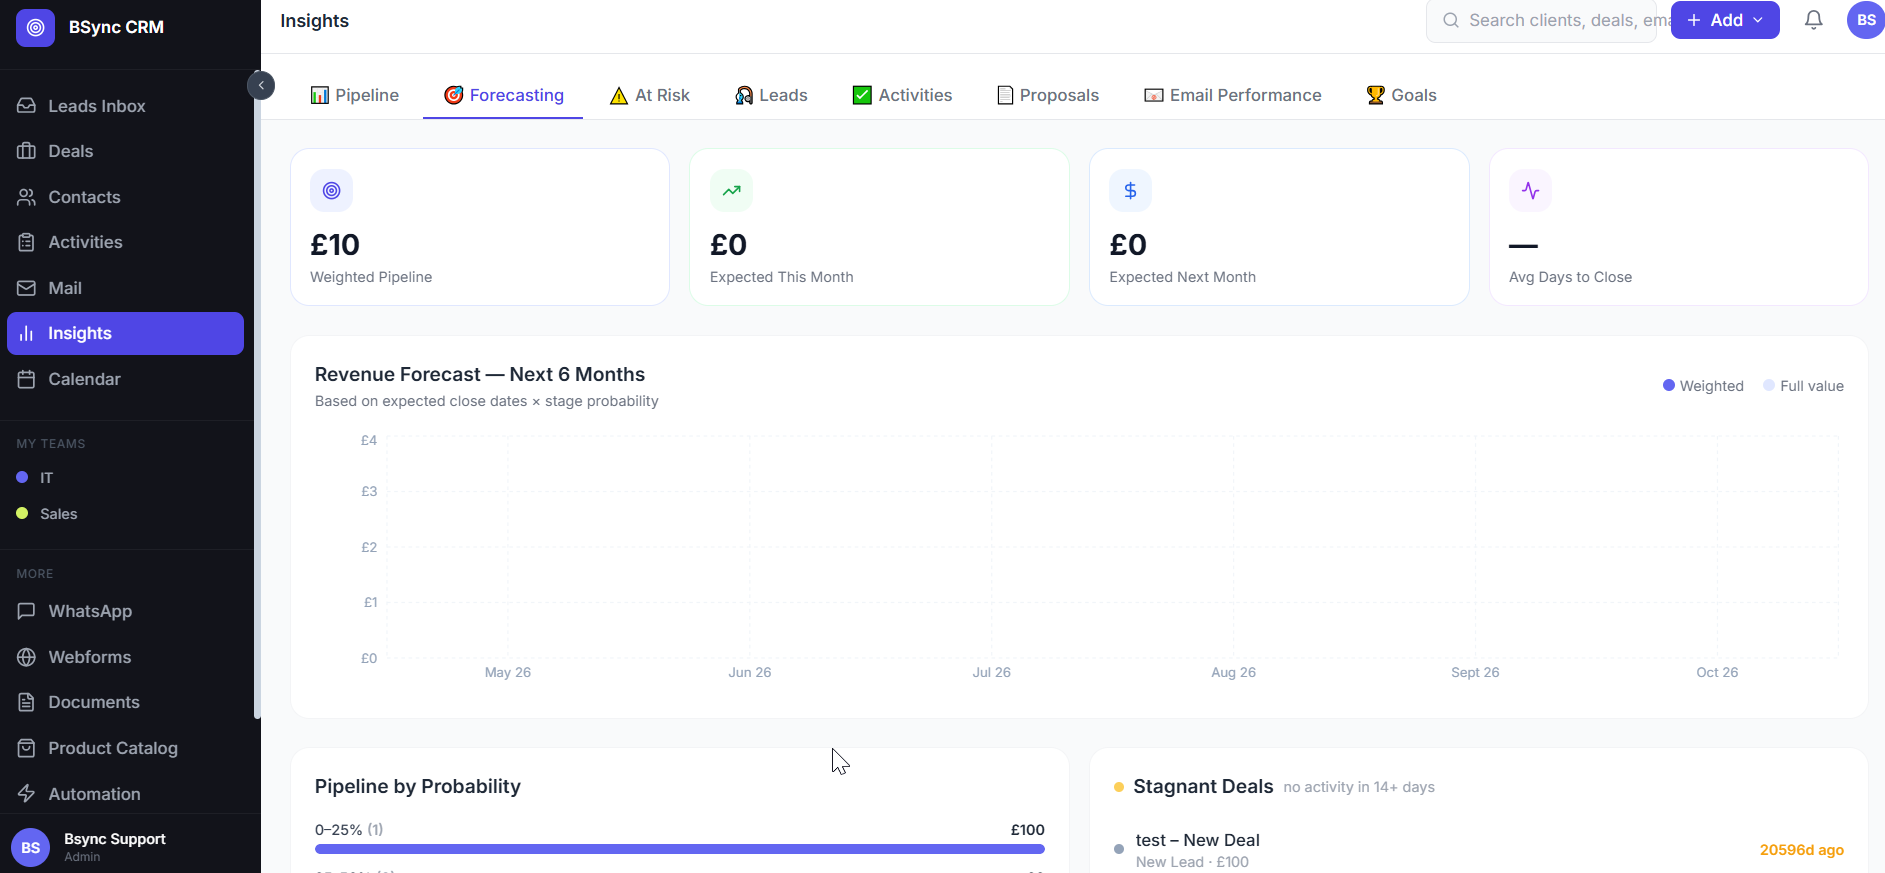
The Forecast chart projects your expected revenue based on the deals currently in your pipeline and their stage probabilities.
How Forecast Is Calculated
Bsynced CRM uses a weighted forecast model:
Forecast = Sum of (Deal Value × Stage Probability) for all open deals
           with close dates in the selected period
For example:
- Deal A: £20,000 at 80% → contributes £16,000
- Deal B: £5,000 at 40% → contributes £2,000
- Deal C: £10,000 at 60% → contributes £6,000
- Weighted forecast: £24,000
Forecast Views
Toggle between:
- Monthly forecast — expected revenue grouped by close month
- Quarterly forecast — rolled up by quarter
- Cumulative — running total across the period
Won vs. Forecast Comparison
The forecast chart overlays:
- Closed Won revenue (solid bar) — actual signed revenue
- Weighted forecast (lighter bar) — projected from open deals
- Target / quota (dashed line) — set in Goals
This lets you see at a glance whether you are on track to hit your target.
Deals at Risk
The At Risk section highlights deals that need attention:
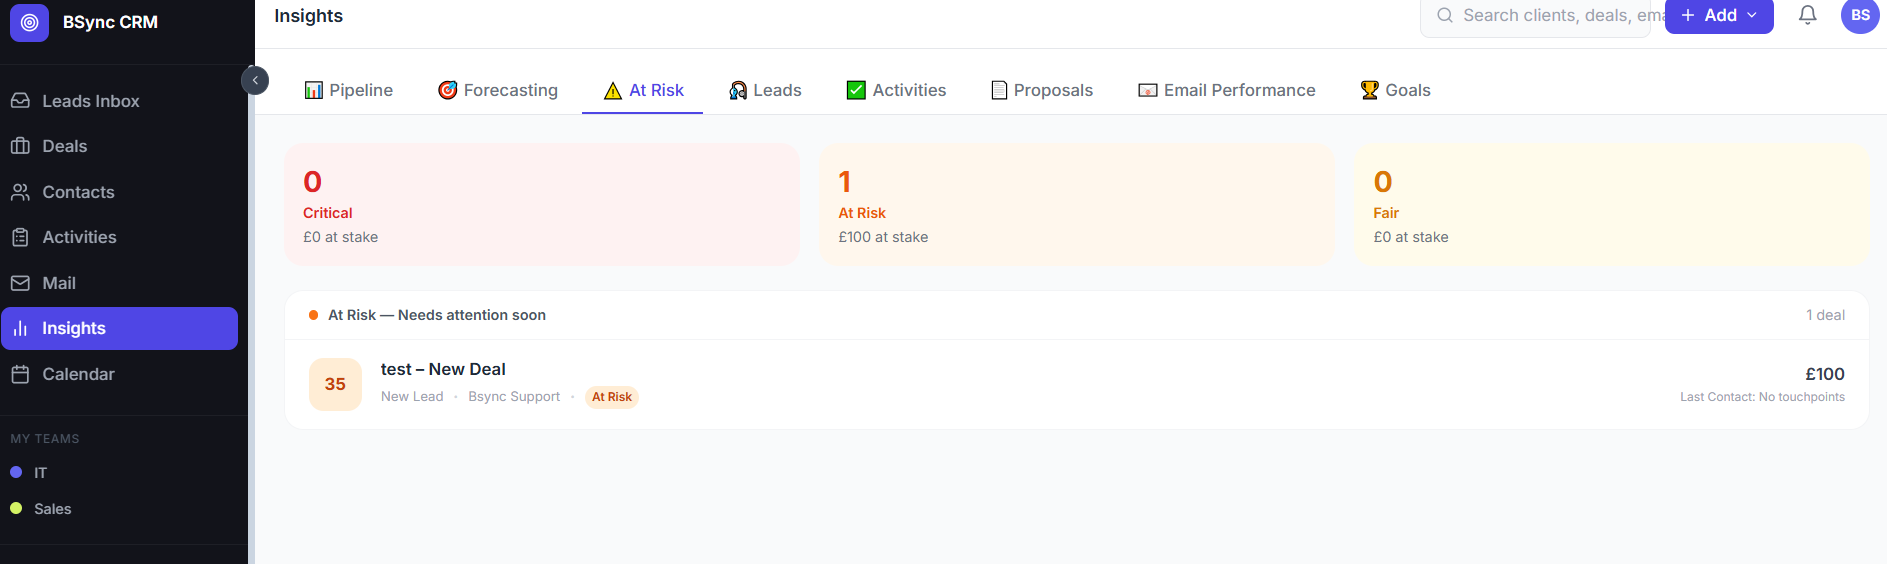
A deal is flagged as at-risk when:
- The close date has passed and the deal is still open
- No activity has been logged in the last 14 days (configurable)
- The deal has been in the same stage for longer than your average deal cycle
- The health score has dropped to red
For each at-risk deal you can see the risk reason, the assignee, and quick-action buttons to log an activity or move the stage.
Set activity thresholds
Go to Settings → Insights to configure how many days of inactivity trigger an at-risk flag. The default is 14 days but you can adjust it to match your typical sales cycle length.